Hypoxia and nutrient loading
A common problem in coastal ecosystems is the need to reduce excessive nutrient loads. Since the inflow of nutrients is also the reason why many coastal systems are so productive, food-web models are useful tools to simulate the effects of nutrient load reductions on fish and shellfish communities[1].
To be able to evaluate the trade-offs between the potential reduced productivity as a consequence of nutrient reduction through bottom-up effects, and increased productivity due to improved water quality, negative effects of eutrophication to coastal species need to be quantified and included in the model. Examples of this include hypoxia[2] [3] and harmful algal blooms[4]. The change in frequency and severity of such events under a nutrient reduction scenario needs to be simulated as well, which often requires hydrodynamic-biogeochemical-lower trophic level models that can then be coupled to an Ecospace model[5], or otherwise used to inform or constrain the nutrient flows in Ecospace[6].
Ecospace can currently serve as a powerful coupled modeling framework to simulate effects on higher trophic levels of eutrophication, hypoxia and/or HABs, and to simulate how nutrient load reductions affect these coastal systems and the species that reside in them. In Piroddi et al.[7], a pan-European marine modeling ensemble of fourteen high trophic level models was developed to assess the impact of eutrophication reduction in European Regional Seas. The study included Ecospace models for almost all European seas under two nutrient reduction management scenarios. The main goal was to test the impact of legislation and the management measures that have been implemented to halt nutrient overload in marine ecosystems. Results suggested that the proposed nutrient reduction measures may not have a significant impact on the structure and function of European marine ecosystems. Among the assessed criteria, the spawning stock biomass of commercially important fish stocks and the biomass of small pelagic fishes would be the most impacted, albeit with values lower than 2.5%. The impact on species diversity and trophic level indicators was even lower (Figure 1).
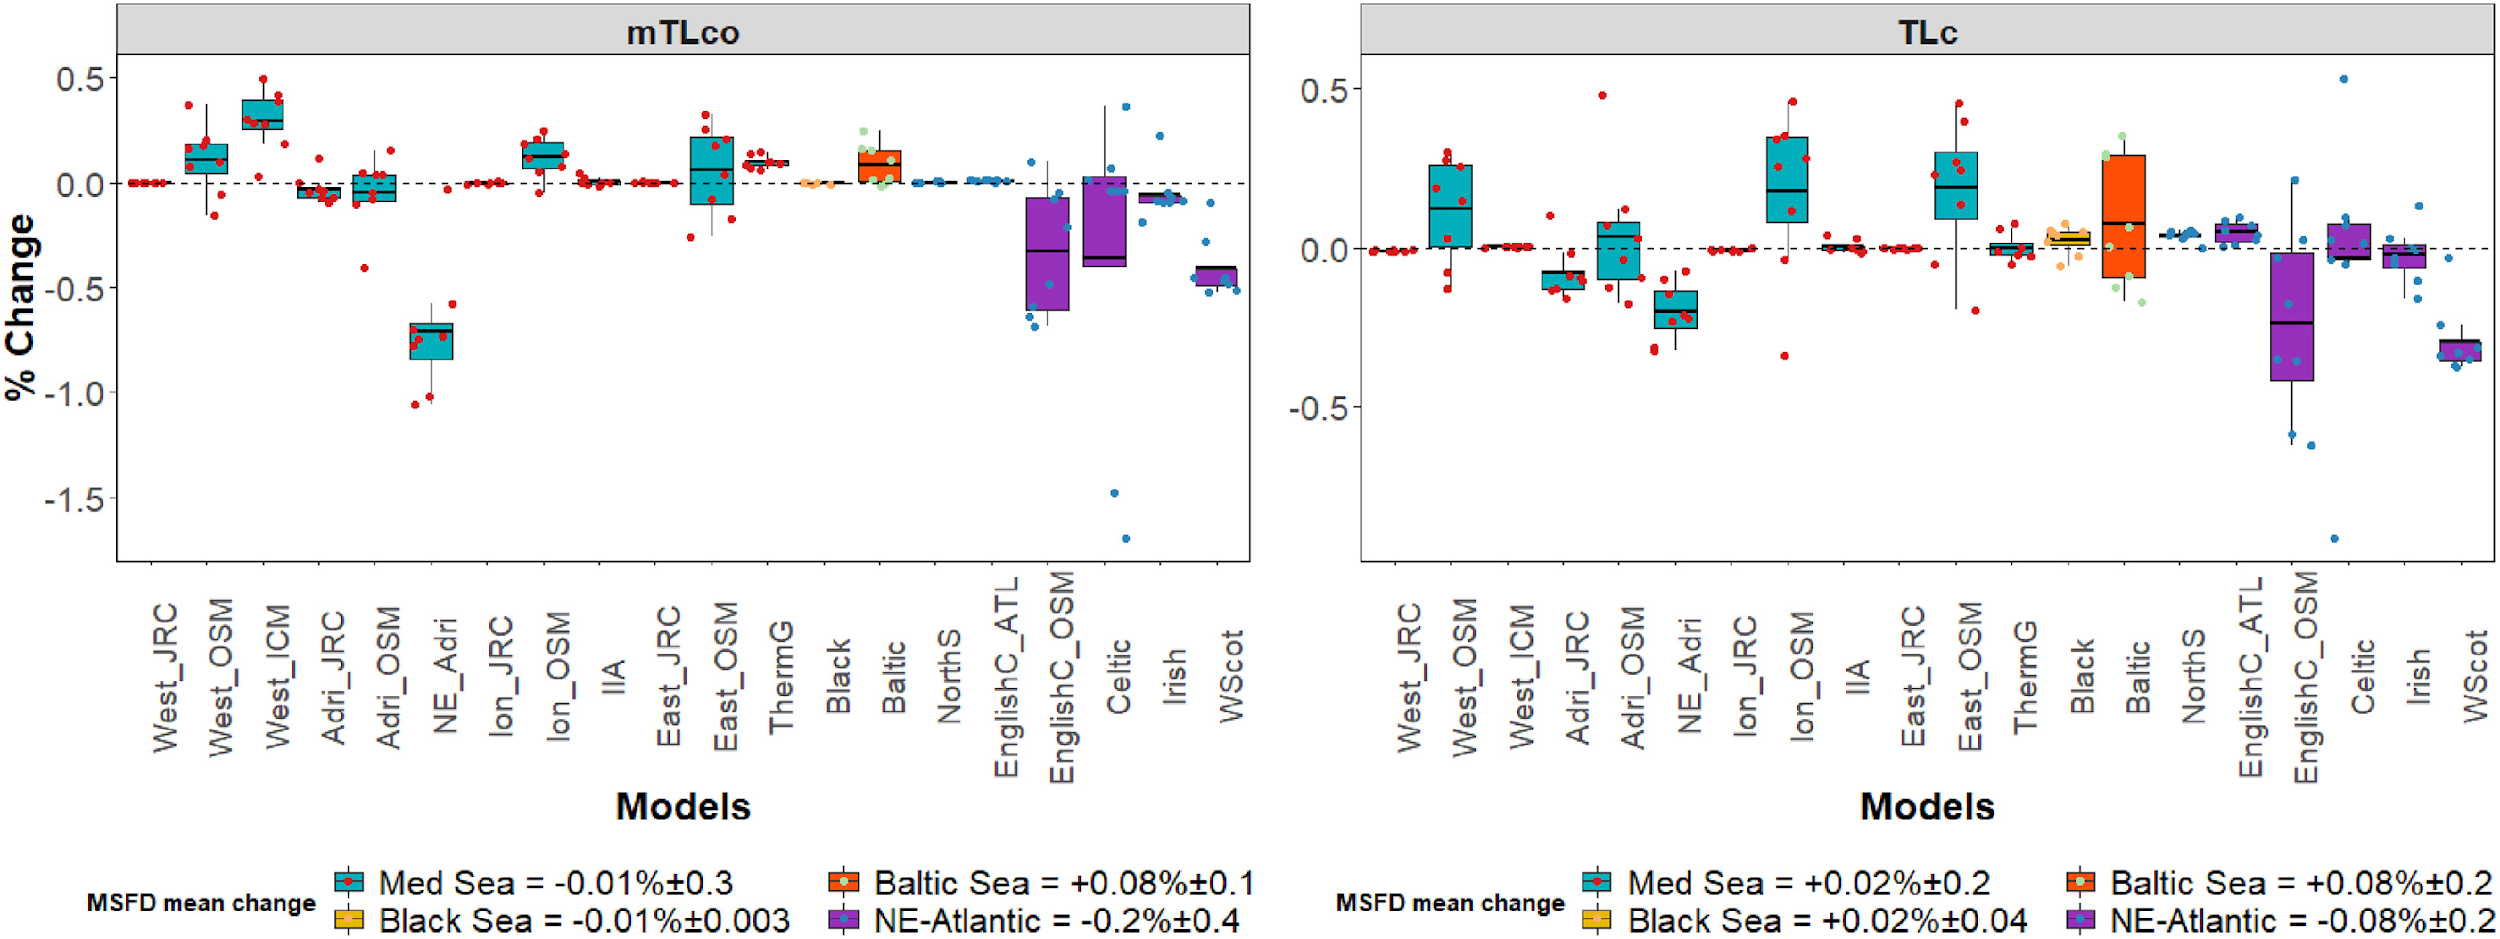
Figure 1. Box plots representing the mean change (%) and standard deviation for TL indicators: (A) Mean trophic level of the community (mTLco); (B) Mean Trophic Level of the Catch (TLc) for every MSFD region/sub-region and smaller areas within an MSFD region/sub-region. Yearly modelled data points are plotted as coloured circles (modified from Piroddi et al.,[8], which lists acronyms)
Attribution
This chapter is based on de Mutsert K, Marta Coll, Jeroen Steenbeek, Cameron Ainsworth, Joe Buszowski, David Chagaris, Villy Christensen, Sheila J.J. Heymans, Kristy A. Lewis, Simone Libralato, Greig Oldford, Chiara Piroddi, Giovanni Romagnoni, Natalia Serpetti, Michael Spence, Carl Walters. 2023. Advances in spatial-temporal coastal and marine ecosystem modeling using Ecopath with Ecosim and Ecospace. Treatise on Estuarine and Coastal Science, 2nd Edition. Elsevier. https://doi.org/10.1016/B978-0-323-90798-9.00035-4, adapted with permission, License Number 5651431253138.
Rather than citing this chapter, please cite the source.
- Piroddi, C., Akoglu, E., Andonegi, E., Bentley, J.W., Celić, I., Coll, M., Dimarchopoulou, D., Friedland, R., de Mutsert, K., Girardin, R., Garcia-Gorriz, E., Grizzetti, B., Hernvann, P.-Y., Heymans, J.J., Müller-Karulis, B., Libralato, S., Lynam, C.P., Macias, D., Miladinova, S., Moullec, F., Palialexis, A., Parn, O., Serpetti, N., Solidoro, C., Steenbeek, J., Stips, A., Tomczak, M.T., Travers-Trolet, M., Tsikliras, A.C., 2021. Effects of Nutrient Management Scenarios on Marine Food Webs: A Pan-European Assessment in Support of the Marine Strategy Framework Directive. Front. Mar. Sci. 8. https://doi.org/10.3389/fmars.2021.596797 ↵
- De Mutsert, Kim, Steenbeek, J., Lewis, K., Buszowski, J., Cowan, J.H., Christensen, V., 2016. Exploring effects of hypoxia on fish and fisheries in the northern Gulf of Mexico using a dynamic spatially explicit ecosystem model. Ecological Modelling 331, 142–150. https://doi.org/10.1016/j.ecolmodel.2015.10.013 ↵
- De Mutsert, K., Steenbeek, J., Cowan, J.H., Christensen, V., 2017. Using Ecosystem Modeling to Determine Hypoxia Effects on Fish and Fisheries, in: Justic, D., Rose, K.A., Hetland, R.D., Fennel, K. (Eds.), Modeling Coastal Hypoxia: Numerical Simulations of Patterns, Controls and Effects of Dissolved Oxygen Dynamics. Springer International Publishing, Cham, pp. 377–400. https://doi.org/10.1007/978-3-319-54571-4_14 ↵
- Sagarese, S., Gray, A.M., Ainsworth, C.H., Chagaris, D., Mahmoudi, B., 2015. Red tide mortality on red grouper (Epinephelus morio) between 1980 and 2009 on the West Florida Shelf (SEDAR42- AW- 01). ↵
- Bauer, B., Meier, H.E.M., Casini, M., Hoff, A., Margoński, P., Orio, A., Saraiva, S., Steenbeek, J., Tomczak, M.T., 2018. Reducing eutrophication increases spatial extent of communities supporting commercial fisheries: a model case study. ICES J Mar Sci 75, 1306–1317. https://doi.org/10.1093/icesjms/fsy003 ↵
- Libralato, S., Solidoro, C., 2009. Bridging biogeochemical and food web models for an End-to-End representation of marine ecosystem dynamics: The Venice lagoon case study. Ecological Modelling 220, 2960–2971. https://doi.org/10.1016/j.ecolmodel.2009.08.017 ↵
- Piroddi et al. 2021. op. cit. ↵
- Piroddi et al. 2021. op. cit. ↵
