Modeling invasive species in a data-poor context
Since first observed in the Barents Sea in 1996, the invasive snow crab Chionoecetes opilio population has been increasing strongly in numbers and spreading westward toward Svalbard and northward. As C. Opilio is an opportunistic predator feeding on a wide array of benthic prey, and have no natural predators, it could have important impacts on the local ecosystem and its fisheries potential. As such, Norwegian managers are interested to know:
- where the crab originated from and how it may spread;
- the carrying capacity of the crab in the local ecosystem and by when this carrying capacity may be reached; and
- the ecological impacts of the crab invasion.
Data for the crab is scarce, both in terms of ecology and in spatial distribution. Whilst awaiting the results of genetic analysis to determine where C. Opilio in the Barents Sea originates from, little is known regarding its life cycle and feeding habits. The only biomass estimates are for male crabs with a shield diameter of at least 10 cm. that are landed; all other caught crabs are discarded.
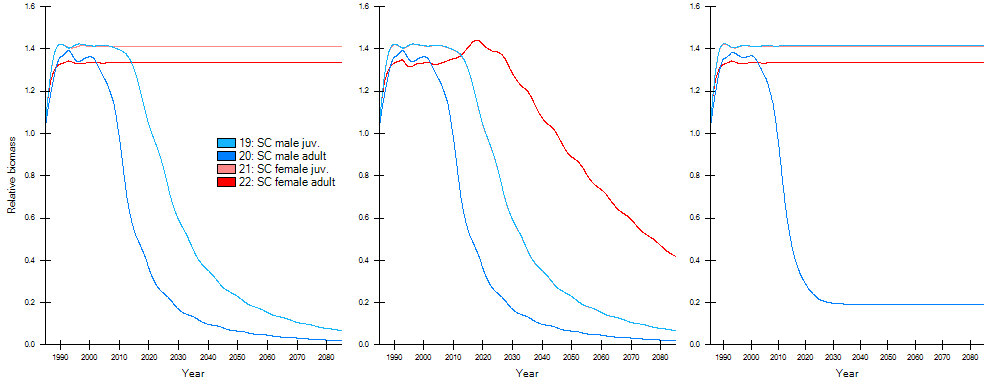
Figure 1. Three simulations with different recruitment linkage configurations for snow crab: no linked recruitment (Left), female recruitment linked to the fished males (Center), and fished male recruitment linked to non-fished females (Right). Note that both juvenile groups are identically parameterized in this specific case, and therefore their biomass estimates exactly overlap in the Center and Right plots[1].
An existing EwE model that featured the C. Opilio[2](Pedersen et al., 2021) was spatialized and refined by dividing the snow crab population in two multi-stanza groups, male and female snow crabs, which each consist of a juvenile and adult life stage. The male biomass observations were entered, and female adult biomasses were estimated based on mean size differences between males and females. The juvenile/adult relationships were parameterized for both multi-stanza groups based on empirical knowledge of known snow crab populations. This setup allowed the model to incorporate the impact of the entire snow crab population, even though only empirical data for male adult C. Opilio were available.
To connect the dynamics between the male and female multi-stanza populations, a new capability was added to EwE to enable linked recruitment between two multi-stanza groups. This ensured that both multi-stanza groups produced the same numbers of recruits (Figure 1, see EwE User Guide), and that extensive fishing of only male snow crab would also affect the number of female recruits.
The Ecospace model of the Barents Sea featured novel uses of Ecospace mechanisms. Monthly averaged trends in sea ice cover were used to impose time varying spatial fisheries restrictions, and the fishing fleets of present nationalities were spatially separated according to historical treaties.
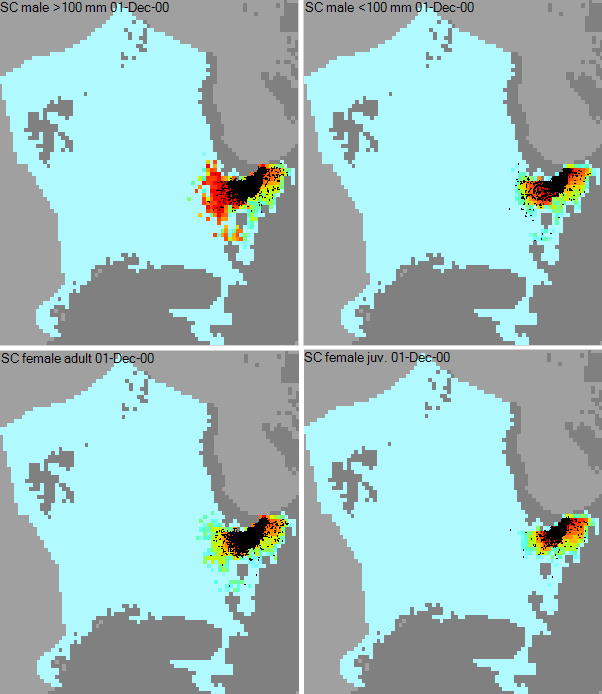
Figure 2. The four groups of C. Opilio, spreading five years after their introduction at the presumed introduction location south of Nova Zemlya. Clockwise, from top-left: adult males, juvenile males, adult females and juvenile females.
In order to discover where the snow crab was first introduced, the habitat suitability of the four snow crab groups was limited to only a few map cells at the start of Ecospace simulations. Once the simulations reached January 1996, this limitation was lifted via the spatial temporal data framework, allowing the multi-stanza groups to disperse naturally from the seed locations. Ecospace was executed in the IBM modus (Figure 2). Several suspected introduction locations were explored under uncertainty assessments. Ecospace hindcasted evolving snow crab distributions and densities that best matched fisheries records when snow crab introduction points were placed at the north and south of Nova Zemlya. This underpins the most broadly accepted hypothesis how the crab entered the area, and can help identifying the native population of the crab, and any studies into their traits and behaviors, to more efficiently manage the invader in the Barents Sea.
Future scenarios have not yet been performed due to lack of data; spatial temporal data at sufficient spatial scale for high-latitude ranges is hard to find for historical time periods, and does not seem to exist for future emission scenarios. The linked stanza feature will be released with EwE version 6.7.
Attribution
The chapter is based on de Mutsert et al.[3], adapted with permission, License Number 5651431253138. Rather than citing this chapter, please cite the source.
- Reproduced from EwE User Guide. ↵
- Pedersen, T., Mikkelsen, N., Lindstrøm, U., Renaud, P.E., Nascimento, M.C., Blanchet, M.-A., Ellingsen, I.H., Jørgensen, L.L., Blanchet, H., 2021. Overexploitation, Recovery, and Warming of the Barents Sea Ecosystem During 1950–2013. Frontiers in Marine Science 8. https://doi.org/10.3389/fmars.2021.732637 ↵
- De Mutsert K, Marta Coll, Jeroen Steenbeek, Cameron Ainsworth, Joe Buszowski, David Chagaris, Villy Christensen, Sheila J.J. Heymans, Kristy A. Lewis, Simone Libralato, Greig Oldford, Chiara Piroddi, Giovanni Romagnoni, Natalia Serpetti, Michael Spence, Carl Walters. 2023. Advances in spatial-temporal coastal and marine ecosystem modeling using Ecopath with Ecosim and Ecospace. Treatise on Estuarine and Coastal Science, 2nd Edition. Elsevier. https://doi.org/10.1016/B978-0-323-90798-9.00035-4 ↵
