Tutorial: Value chain
Santiago de la Puente and Villy Christensen
Learning Objectives
-
Obtain experience building value chains in EwE
The fishing industry around Anchovy Bay is important for peoples’ livelihoods and health, providing both jobs and food. In order to potentially evaluate tradeoffs in fisheries management, we will construct a value chain to describe how the different parts of the fishing industry contribute to the overall economy and social system.
We will use the Anchovy Bay ecosystem model that we constructed in a previous tutorial (download). First open the model and check that it is mass balanced (Ecopath > Output > Basic parameters). Then go to Ecopath > Input > Model parameters and set the model area to 10000 km2 (if not already entered). Also make sure that you have selected the appropriate monetary units. As Anchovy Bay is located somewhere in Europe, lets choose Euros for now.
Then let’s go to Ecopath > Input > Fishery > Off-vessel price. Currently we have five fleets. Each functional group-fleet combination requires an off-vessel price (change the default values). A ton of seals should be worth € 600, a ton of cod should be worth € 1,400, a ton of whiting should be € 200, a ton of mackerel should be worth € 350, a ton of anchovy should be € 160 and a ton of shrimp € 17,000. However, we know that anchovies when caught by bait boats are landed in better condition and hence are worth more. Please include a price for them of € 160 per ton when caught by bait boats.
Next go to Ecopath > Output > Tools > Value chain. This will load the value chain plug-in of EwE. On the parameters form, check “Run with Ecopath”. Then go to the flow form. Select Add > Create producers for fleets, then click Arrange, and say Yes, if it asks if you want to save. You should now have five fleets as boxes on your flow chart form. The five producers will be linked to the EwE model and pick up baseline landings (and off-vessel prices) by fleets from the base model.
Next, we need to add processors, distributors, wholesalers, retail sellers and consumers to the value chain (and link them together). You can rename the enterprises in the properties table (click on a box and look at the right section of the screen).
- Shrimpers, Trawlers and Seiners sell their catch to Primary processors who fillet the fish and cut it into portions. Fresh seafood products are then sold to Coolers, distributors that transport them in refrigerated containers to Fresh seafood wholesalers. Retailers like Restaurants that cater Tourists and Fish mongers that sell fish to Local consumers purchase their seafood from the Fresh seafood wholesalers.
- Seiners and Bait boats sell their catch to the Canneries. Canneries place their production in Warehouses using Trucks. Trucks are a distributing company that does not purchase the cannery’s production. They charge a fee for the service of delivering the product to a warehouse that needs it (i.e., acts like a broker). Warehouses sell products to Supermarkets where Local and Regional consumers can place their orders.
- Trawlers also sell part of their catch to Freezing plants. These sell their production to a distributing company, Frost Trucks, that sell this production to the same Warehouses that purchase canned seafood.
- Sealers sell their catch to the Anchovy Bay Company (ABC), which processes seals into fancy pelts. These are directly sold to Regional consumers.
Your value chain should look something like in Figure 1.
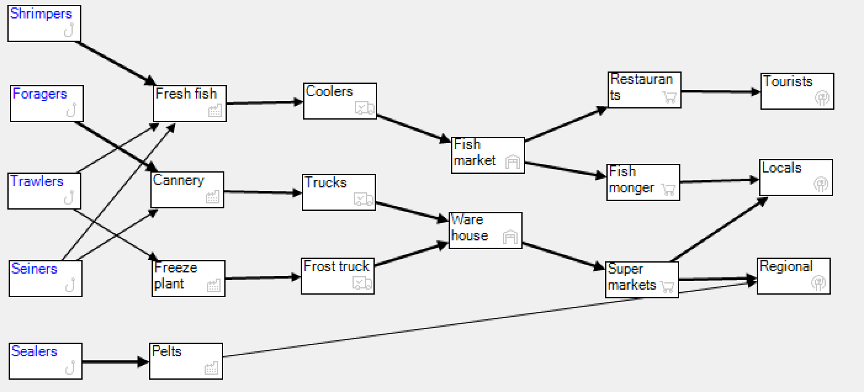
Figure 1. Screenshot of value chain implementation for Anchovy Bay. The enterprises are arranged with producers (= fleets in EwE model) in the first column (with a hook icon). Processors are in the second column (with building icon), distributors in the third column (with semi truck icon), whole sellers in the fourth column (with shop icon), retailers including restaurants are in the fifth column (with shopping cart icon), and consumers are in the last column. The boxes in the value chain are connected with arrows, the width of which indicate what proportion of the flow leaving a given box is passed on to the connected box. The producers receives catches from the EwE model (all modules) and passes these on through the value chain.
However, you may notice that the Trawlers and Seiners are color marked in your flowchart. This lets us know that we need to specify how the landings are distributed between the processors they supply. You do this by clicking Move, then click the link between (e.g., Trawlersand Primary Processors). In the properties table to the right, select a functional group (e.g., cod), and add a biomass ratio (e.g., 0.5). However, it is much easier to add all of this in Value chain > Components > Landings.
We can for this tutorial populate the Anchovy Bay value chain by downloading a spreadsheet with input tables from this link. For convenience, we have included a table with the landing distributions in Tabel 1. You can copy the information from this table (or from the Landings tab in the spreadsheet).
Table 1. Landing distributions for the Anchovy Bay value chain analysis. The table is included in the Anchovy_bay_value_chain.xlsx spreadsheet.
| Name | Source | Target | External | BiomassRatio | ValueRatio | EcopathGroupName | |
| 1 | Landings of 2: Seals | Sealers | ABC | False | 1 | 1 | 2: Seals |
| 2 | Landings of 3: Cod | Trawlers | Primary processors | False | 0.5 | 1.1 | 3: Cod |
| 3 | Landings of 3: Cod | Trawlers | Freezing plants | False | 0.5 | 0.9 | 3: Cod |
| 4 | Landings of 4: Whiting | Trawlers | Primary processors | False | 0.5 | 1.1 | 4: Whiting |
| 5 | Landings of 4: Whiting | Trawlers | Freezing plants | False | 0.5 | 0.9 | 4: Whiting |
| 6 | Landings of 5: Mackerel | Seiners | Canneries | False | 0.5 | 1.2 | 5: Mackerel |
| 7 | Landings of 5: Mackerel | Seiners | Primary processors | False | 0.5 | 0.8 | 5: Mackerel |
| 8 | Landings of 6: Anchovy | Bait boats | Canneries | False | 0.5 | 1 | 6: Anchovy |
| 9 | Landings of 6: Anchovy | Seiners | Canneries | False | 0.25 | 1 | 6: Anchovy |
| 10 | Landings of 6: Anchovy | Seiners | Primary processors | False | 0.25 | 0.8 | 6: Anchovy |
| 11 | Landings of 7: Shrimp | Shrimpers | Primary processors | False | 1 | 1 | 7: Shrimp |
Now let’s go to Run value chain, set data aggregation to Results by fleet and Run Ecopath. You can now explore results by fleet, by enterprise type, and by combinations. As you can see this run tells you a lot about revenue, but little about employment and profits. So, let’s add a bit more data.
First let’s add more information about the flows of biomass and data along the value chain. Go to Value chain > Components > Links. Then copy / paste the information from Table 2 (below) or from the Links tab in the spreadsheet.
Table 2. Enterprise links for the Anchovy Bay value chain analysis.
| Name | Source | Target | External | BiomassRatio | ValuePerTon | ValueRatio | |
| 1 | Cannery to Trucks | Canneries | Trucks | False | 0.5 | 1.9 | |
| 2 | Coolers to Fresh fish | Coolers | Fresh fish | False | 1 | 3 | |
| 3 | Fish monger to Locals | Fish mongers | Locals | False | 1 | 5 | |
| 4 | Freezing plant to Frost trucks | Freezing plants | Frost trucks | False | 0.8 | 2.3 | |
| 5 | Fresh fish to Coolers | Primary processors | Coolers | False | 0.7 | 1.7 | |
| 6 | Fresh fish to Fish monger | Fresh fish | Fish mongers | False | 0.8 | 2 | |
| 7 | Fresh fish to Restaurants | Fresh fish | Restaurants | False | 0.2 | 5 | |
| 8 | Frost trucks to Warehouse | Frost trucks | Warehouses | False | 1 | 2.5 | |
| 9 | Pelts to Regional | ABC | Regional | False | 0.15 | 40000 | 0 |
| 10 | Restaurants to Tourists | Restaurants | Tourists | False | 1 | 7 | |
| 11 | Supermarket to Locals | Supermarkets | Locals | False | 0.6 | 3 | |
| 12 | Supermarket to Regional | Supermarkets | Regional | False | 0.4 | 3 | |
| 13 | Trucks to Warehouse | Trucks | Warehouses | False | 1 | 4 | |
| 14 | Warehouse to Supermarket | Warehouses | Supermarkets | False | 1 | 1.2 |
Now go to Run value chain and Run Ecopath. What new things do you see?
One final step. Let’s add some costs for the producers. Please copy the costs from Table 3 or from the Producers tab in the spreadsheet. Go to Run value chain and Run Ecopath once again. Can you find any enterprise with negative profits? Why are they negative?
Table 3. Cost structure for producers in the Anchovy Bay value chain analysis.
| Producer | 1 | 2 | 3 | 4 | 5 |
| Name | Bait boats | Sealers | Seiners | Shrimpers | Trawlers |
| Category | Producer | Producer | Producer | Producer | Producer |
| Nationality | 0 | 0 | 0 | 0 | 0 |
| Broker | False | False | False | False | False |
| Name (local) | |||||
| Ecopath fleet | 4 | 1 | 3 | 5 | 2 |
| Unlikely outputs | |||||
| Biomass ratio | |||||
| Energy products | 0 | 0 | 0 | 0 | 0 |
| Industrial products | 0 | 0 | 0 | 0 | 0 |
| Service products | 0 | 0 | 0 | 0 | 0 |
| Ticket revenue | 0 | 0 | 0 | 0 | 0 |
| Energy subsidy | 0 | 0 | 1 | 0 | 1 |
| Other subsidies | 0 | 0 | 0 | 0 | 0 |
| Female worker pay | 0 | 0 | 0 | 0 | 0 |
| Male worker pay | 0 | 0 | 0 | 0 | 0 |
| Female owners pay | 0 | 0 | 0 | 0 | 0 |
| Male owners pay | 0 | 0 | 0 | 0 | 0 |
| Other worker pay | 0 | 0 | 0 | 0 | 0 |
| Female worker share | 30 | 50 | 15 | 20 | 10 |
| Male worker share | 30 | 50 | 15 | 20 | 10 |
| Female owners share | 0 | 0 | 0 | 0 | 0 |
| Male owners share | 0 | 0 | 0 | 0 | 0 |
| Capital cost | 5 | 2 | 1 | 1 | 1 |
| Energy cost | 10 | 2 | 15 | 8 | 12 |
| Industrial cost | 0 | 0 | 0 | 0 | 0 |
| Services cost | 0 | 0 | 0 | 0 | 0 |
| Management cost | 0 | 1 | 2 | 0.5 | 0.5 |
| Royalty cost | 0 | 0 | 0 | 0 | 0 |
| Certification cost | 0 | 0 | 0 | 0 | 0 |
| Monitoring cost | 0 | 1 | 5 | 1 | 3 |
| Monitor coverage rate | 1 | 1 | 1 | 1 | 1 |
| Environmental tax | 0 | 0 | 0 | 0 | 0 |
| Export tax | 0 | 0 | 0 | 0 | 0 |
| Import tax | 0 | 0 | 0 | 0 | 0 |
| Production tax | 0 | 0 | 0 | 0 | 0 |
| Profit tax (prop.) | 0 | 0 | 0 | 0 | 0 |
| VAT tax | 0 | 0 | 0 | 0 | 0 |
| License tax | 0 | 0 | 0 | 0 | 0 |
| No. female workers | 0 | 0 | 0.01 | 0.01 | 0 |
| No. male workers | 0.6 | 2 | 0.5 | 1 | 0.9 |
| No part-time workers | 0 | 0 | 0 | 0 | 0 |
| No. other workers | 0 | 0 | 0 | 0 | 0 |
| No. female owners | 0 | 0 | 0 | 0 | 0 |
| No. male owners | 0 | 0 | 0 | 0 | 0 |
| Female worker dependents | 0 | 0 | 0 | 0 | 0 |
| Male worker dependents | 0 | 0 | 0 | 0 | 0 |
| Female owner dependents | 0 | 0 | 0 | 0 | 0 |
| Male owner dependents | 0 | 0 | 0 | 0 | 0 |
If everything else fails (or you want to take a shortcut). Here’s a link to an Anchovy Bay model with the value chain database.
