Episodic mortality events
There are many short-lived stressors affecting marine and coastal environments that occur over only a portion of the ecosystem. Often, exposure to these stressors can result in immediate mass mortality of marine organisms in the affected area. Examples of such episodic mortality events include toxic and harmful algal blooms, hypoxia, temperature extremes, and chemical spills. When modeling impacts, it is important to consider the spatial and temporal overlap between the stressor and species in the ecosystem, as well as the severity of the stressor, lethality, sub-lethal effects, and food-web effects. Sub-lethal effects of the stressor can be captured through the Ecospace habitat capacity model, which reduces foraging capacity in affected cells, resulting in lower consumption rates, slower growth, and movement away from the area.
In EwE version 6.6+, Ecospace can directly include mortalities in response to environmental stressors, in addition to the feeding responses enabled through the habitat capacity model[1] [2]. The mortality response functions can take any form, but would typically follow a logistic function, similar to dose-response curves common in ecotoxicology studies. When combined with the mortality response, the foraging response may in some cases moderate the lethal effects by driving movement away from the stressor. Food web effects may lead to slower recovery times following an episodic mortality event if, for example, the forage base is severely reduced. In addition, food web dynamics can also lead to compensatory increases in biomass due to lower abundances of predators and competitors.
The Ecospace mortality response functions were conceptualized to simulate the impacts of red tides on the West Florida Shelf (WFS). Red tide blooms are caused by the toxic dinoflagellate Karenia brevis and occur almost annually on the WFS, often leading to mass mortality of invertebrates, fish and marine megafauna. Stock assessment models by SEDAR for gag Mycterpera microlepis and red grouper Epinephelus morio have attempted to account for red tide mortality, and managers have been forced to make decisions about future catch levels while red tide blooms were ongoing.
An existing Ecospace model of the WFS was adapted to include red tides and estimate mortality rates of key species[3] (Figure 1). Monthly maps of K. brevis cell concentration (ranging from 0 to 106 cells/l) were included as an environmental driver using the spatial-temporal framework. Information on species-specific responses to red tide is lacking, but it is generally understood that fish kills are likely when cell concentrations are >105 cells/l. To address this uncertainty, a set of logistic mortality and foraging response functions were evaluated with varying slopes and inflection points. Time series of red tide mortality rate were then generated from the simulations, by dividing the biomass loss due to red tides by total biomass, which was then fed back into the stock assessment model and management projections.
In addition, the WFS Ecospace model identified red tide as a possible driver of gag recruitment dynamics, demonstrating delayed recovery times of gag when the entire food web was impacted by red tide. The model also demonstrated different effects across marine taxa due to spatial overlap with red tide (severe blooms typically occur nearshore) and movement rates (migratory pelagics were less affected by red tide).
The approach described here for red tide on the WFS can be generalized to other stressors that are spatially restricted and cause direct mortality. It also provides a way to integrate studies conducted across multiple scales, from individuals to populations and ecosystems, using the Ecospace spatial-temporal framework and environmental response functions.
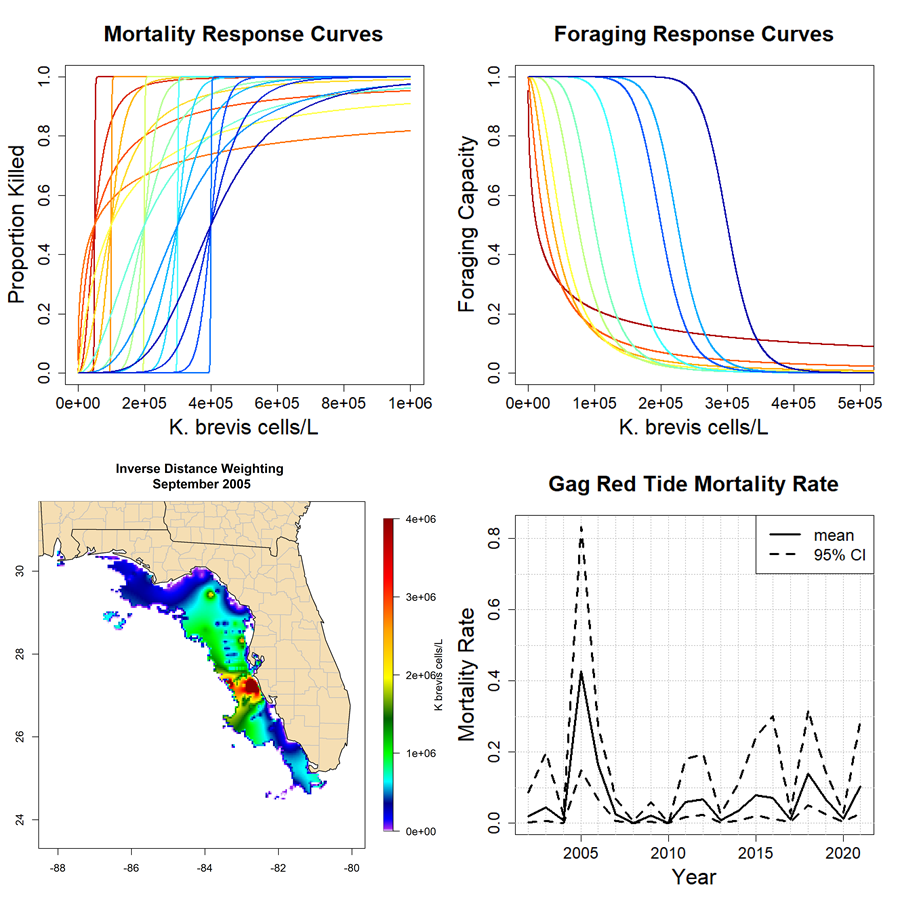
Figure 1. Red tide mortality and foraging response curves used in the WFS Ecospace model (top row), an example monthly map of red tide cell concentrations input as an environmental driver using the Ecospace spatial temporal data framework (bottom left), and the resulting red tide mortality for gag grouper from 2002-2021[4]
Attribution
The chapter is based on de Mutsert et al.[5], adapted with permission, License Number 5651431253138. Rather than citing this chapter, please cite the source.
- Christensen, V., Coll, M., Steenbeek, J., Buszowski, J., Chagaris, D., Walters, C.J., 2014. Representing Variable Habitat Quality in a Spatial Food Web Model. Ecosystems 17, 1397–1412. https://doi.org/10.1007/s10021-014-9803-3 ↵
- Vilas, D., Chagaris, D., Buszowski, J., 2020. Red tide mortality on gag grouper from 2002-2018 generated by an Ecospace model of the West Florida Shelf. SEDAR, North Charleston SC. ↵
- Vilas et al. 2020, op. cit. ↵
- Figure modified by de Mutsert et al. 2023 from Vilas, D., Chagaris, D., Buszowski, J., 2020. Red tide mortality on gag grouper from 2002-2018 generated by an Ecospace model of the West Florida Shelf. SEDAR, North Charleston SC. ↵
- De Mutsert K, Marta Coll, Jeroen Steenbeek, Cameron Ainsworth, Joe Buszowski, David Chagaris, Villy Christensen, Sheila J.J. Heymans, Kristy A. Lewis, Simone Libralato, Greig Oldford, Chiara Piroddi, Giovanni Romagnoni, Natalia Serpetti, Michael Spence, Carl Walters. 2023. Advances in spatial-temporal coastal and marine ecosystem modeling using Ecopath with Ecosim and Ecospace. Treatise on Estuarine and Coastal Science, 2nd Edition. Elsevier. https://doi.org/10.1016/B978-0-323-90798-9.00035-4 ↵
