18 Age-structured dynamics
The default approach in EwE is to model functional groups as biomass pools that in Ecosim have very simple dynamics. For such, Ecosim – as described in previous chapters – solves a set of differential equations for biomass rate of change of the form,
[latex]dB_i / dt = eQ_i(t) - Z_i(t) \ B_i \tag{1}[/latex]
This simple representation does not allow for modelling species with complex trophic ontogeny or size-age dependent fishery impacts. Such groups can, however, be designated age-structured life-history stanzas within single-species populations. In such cases, the Ecosim differential equation solution for biomass change (Eq. 1) is replaced by a monthly-difference equation system, with full monthly age-structured accounting for population age and size structure.
With this approach, Ecosim can be used to simulate monthly changes in numbers and relative body weights of monthly age cohorts of species with complex trophic and fisheries impact ontogeny. For this, the start is to split any species into an arbitrary number of age (in months) “stanzas” as described earlier in the multi-stanza life history chapter. For such groups, prey preferences and vulnerability to predators (and fisheries) is then treated as constant over the months of age included within each stanza. Stanza age breaks can represent both ontogenetic shifts in habitat and diet and changes in vulnerability to bycatch and retention fisheries.
Ecosim differential equation representation for biomass change is replaced by a monthly-difference equation system, with full age-structured accounting for population age and size structure at monthly age increments. The basic accounting relationships are
[latex]N_{a+1,t+1}=N_{a,t} \exp(-Z_{s,t}/12) \tag{4}[/latex]
[latex]W_{a+1,t+1}=\alpha_a q_{a,t}+ \rho W_{a,t} \tag{5}[/latex]
[latex]B_{s,t}=\sum\limits_{a=a1(s)}^{a2(s)} N_{a,t}W_{a,t} \tag{6}[/latex]
Where, Na,t is the number of age a (in months) animals in calendar month t, Wa,t is the mean body weight of age a animals in month t, and Bs,t is the biomass of stanza s, defined as the mass (numbers × weight) of animals aged a1(s) through a2(s) months. Zs,t is the total mortality rate of stanza s animals, defined the same way on the basis of fishing and consumption as for other model biomass groups i as Zs,t = Mos + ΣfFsf + ΣjQsj/Bs. All animals in stanza s are treated as having the same predation risk and vulnerability to fishing. The aggregated bioenergetics parameters aa and r are calculated to make body growth follow a von Bertalanffy growth curve (with length-weight power 3.0) with user-defined metabolic parameter K. Exact von Bertalanffy growth occurs when predicted per-capita food intake qa,t is equal to a base food intake rate that is calculated from the consumption per biomass parameter (Qs/Bs) provided by the user for each stanza. The metabolic parameter r, which equals exp(–3K/12), is based on the assumption that metabolism is proportional to body weight[1]. Actual or realized food intake qs,t at each time step is calculated from the total predicted food-intake rate for the stanza (Qs,t) as qs,t = Qs,twa,t2/3/Ps,t, where Ps,t is the relative total area searched for food by stanza s animals and is computed as Ps,t = ΣaNa,twa,t2/3. For foraging-arena food-intake and predation-rate calculations involving stanzas, Ps,t is used instead of Bs as the predictor of total area or volume searched for food per unit time. The assumption that area searched and food intake vary as the ⅔ power of weight (i.e., as the square of body length) is a basic assumption that also underlies the derivation of the von Bertalanffy growth function.
For notational simplicity, Eqs. 4–6 above are presented without a species index. Typical Ecosim models developed to date have included multistanza accounting for 2–10 species, each divided into 2–5 stanzas that capture basic ontogenetic changes in diet, predation risk, and vulnerability to fishing. The first age for stanza 1 is always set to a1(1) = 0 (hatching), and a2(1) is often set to 3–6 months of age to represent the larval and early juvenile periods separately. Then a2(2) is often set at 12–24 months (to represent older juveniles), and additional stanza breaks are set at key ages like maturity and first vulnerability to fishing.
Initial numbers entering the first stanza for multistanza species s each month are assumed to be proportional to total egg production, and egg production is assumed to be proportional to body weight minus a weight at maturity Ws,mat. That is,
[latex]N_{1,t}= k_s \ \sum\limits_{a}N_{a,t}[W_{a,t}-W_{s,mat}] \tag{7}[/latex]
The effective fecundity parameter, ks is calculated from initial numbers, N1,0, and these initial numbers are calculated in turn from Ecopath input values of biomass for one “leading” stanza for each species s, along with initial survivorships to age calculated from initial Ecopath input values of Za,0. For these calculations, relative body weights, Wa,0, are set initially to the von Bertalanffy prediction, and weight is assumed to vary as the cube of length, as Wa,0 = (1 – e–Ksa)3.
Egg production is allowed to vary seasonally or over long-term through an input forcing function. If an egg production curve is defined, the egg production term is multiplied according to the forcing function. Note that this age-0 recruitment formulation for newly entering animals proportional to egg production does not explicitly account for density dependence in early mortality rates (i.e., an explicit stock-recruitment function is not used). Density-dependent effects occur through (1) impacts of animal density on food consumption, growth, and fecundity (a time-lagged effect that can result in violent population cycles) and, more importantly and commonly, (2) density dependence in Zs,t caused by foraging-time adjustments in the Ecosim foraging-arena model for Qs,t. Foraging-time adjustments typically result in emergent stock-recruitment relationships of Beverton-Holt form.[2] [3]
The Ecosim multistanza model has been fitted to many time series of population abundances that were reconstructed from single-species age-structure data by methods like VPA[4] and stock-reduction analysis[5]. Species fitted range from tunas to groupers to small pelagics like menhaden. For large, relatively long-lived species (piscivores, benthivores), behavior of the multistanza population model is typically indistinguishable from those of other age-structured models commonly used for stock assessment. For small-bodied species subject to high and temporally varying predation-mortality rates (e.g., small tunas, herrings, menhaden), Ecosim can sometimes capture effects such as relative stability of Z as F increases (decreases in M with increasing F) that are typically missed by singlespecies models that assume stable natural mortality rate M[6].
On entry to Ecosim from Ecopath, the stanza age-size distribution information (la, Wa) is passed along and is used to initialize a fully size-age structured simulation for the multi-stanza populations. That is, for each monthly time step in Ecosim, numbers at monthly ages Na,t and body weights Wa,t are updated for ages up to the 90% maximum body weight age (older, slow growing animals are accounted in an "accumulator" age group). The body growth Wa,t calculations (Eq 5) are parameterized so as to follow von Bertalanffy growth curves[7], with growth rates dependent on body size and (size- and time-varying) food consumption rates.
Because a biomass-age pattern (and food consumption–age pattern proportional to w⅔) like that in Figure 1 must be satisfied once stanza-specific base Z’s have been specified for every stanza, initial biomass Bi0 and food consumption per biomass, Qi0/Bi0, can only be entered for one stanza (biomass pool i) for each multi-stanza species s. Then B and Q/B are calculated for the other stanzas from the relative (per recruit) biomass and food consumption rates summed over ages in those stanzas.
At this point, the Ecosim age structured dynamics behave pretty much the same as standard age-structured models for single species assessments, but with the important exception that such models typically include an explicit stock-recruitment relationship. Instead of using such a relationship, Ecosim generates an "emergent" compensatory relationship through assumptions related to the foraging arena equations; see the following Recruitment and compensation chapter for details.
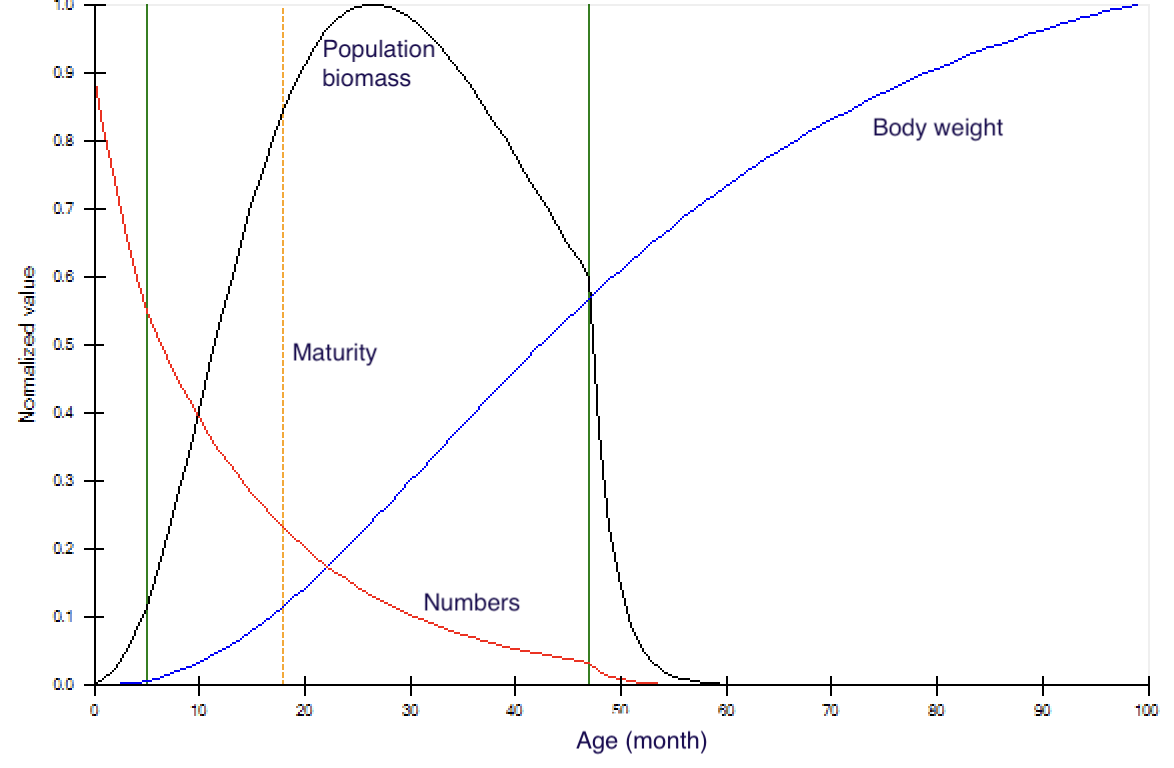
Figure 1. Typical changes in individual biomass and population numbers and biomass with age for a multi-stanza population in Ecosim. In this example, von Bertalanffy K = 0.4 year–1, and the three stanzas marked by the outer vertical lines have the following total mortality rates, Z: 1.2 year–1 for age 0–5 months, 0.8 year–1 for age 6–47 months, and 6.0 year–1 for ages 48+ months (moribund salmon). The dotted vertical line indicates age-at-maturity, which can be overruled by setting a spawning/not-spawning variable for each stanza.
- Essington, T. E., J. F. Kitchell, and C. J. Walters. 2001. The von Bertalanffy growth function, bioenergetics, and the consumption rates of fish. Can. J. Fish. Aquat. Sci. 28: 2129–2138. https://doi.org/10.1139/f01-151 ↵
- Walters C and J. Korman. 1999. Revisiting the Beverton-Holt recruitment model from a life history and multispecies perspective. Rev. Fish Biol. Fish. 9: 187–202. https://doi.org/10.1023/A:1008991021305 ↵
- Walters C and S. J. D. Martell. 2004. Fisheries Ecology and Management. Princeton Univ. Press, Princeton. 399 p. ↵
- Sparre, P. 1991. An introduction to multispecies virtual analysis. ICES Mar. Sci. Symp. 193: 12–21. ↵
- Walters CJ, Martell SJD, and Korman J. 2006. A stochastic approach to stock reduction analysis. Can. J. Fish. Aquat. Sci. 63: 212–223. https://doi.org/10.1139/f05-213 ↵
- see, e.g., Walters, C, Martell, SJD, Christensen, V, and Mahmoudi, B. 2008. An Ecosim model for exploring ecosystem management options for the Gulf of Mexico: implications of including multistanza life history models for policy predictions. Bull. Mar. Sci. 83(1): 251-271 ↵
- Von Bertalanffy, op. cit. ↵
- Walters, C, Martell, SJD, Christensen, V, and Mahmoudi, B. 2008. An Ecosim model for exploring ecosystem management options for the Gulf of Mexico: implications of including multistanza life history models for policy predictions. Bull. Mar. Sci. 83(1): 251-271 ↵
- Walters, C., Christensen V, Walters W, Rose K. 2010. Representation of multi-stanza life histories in Ecospace models for spatial organization of ecosystem trophic interaction patterns. Bull. Mar. Sci. 86(2):439-459 ↵
