35 Case study: Fitting impact on vulnerability multipliers
Jacob Bentley; David Chagaris; Marta Coll; Sheila JJ Heymans; Natalia Serpetti; Carl J. Walters; and Villy Christensen
The Anchovy Bay ecosystem model that is used to describe and test EwE scenarios throughout this text book was used to investigate how vulnerability multipliers emerge (and whether they re-emerge through fitting) and how this process is influenced by:
- noise in the calibration data, and
- the chosen approach for estimating vulnerability multipliers: “predator” or “predator-prey” vulnerability multipliers.
We investigated the impact of emerging vulnerability multipliers on biomass and catch simulations and estimates of fishing mortality consistent with maximum sustainable yield (FMSY).
Building a base Ecosim model[1]
Ecosim simulations for Anchovy Bay were created by adding temporal trends to fishing effort and adjusting vulnerability multipliers. Simulated fishing effort trends reflected trends often seen in reality:
- sealers fishing effort followed an exponential decline as may be expected in response to conservation efforts/policy,
- trawlers fishing effort followed an exponential decline under the assumption that whitefish (cod and whiting) stocks have been overexploited, leading to reductions in effort to encourage stock recovery,
- seiners and bait boat effort followed a slight linear increase in response to growing demand, and
- shrimpers effort increased assuming fishers shifted their target species to shrimp following reduced opportunities to catch white fish.
Vulnerability multipliers (kij) were adjusted following ecological assumptions and assumptions linked to the fishing effort trajectories. To distinguish between scenarios more easily, predator vulnerability multipliers will hereafter be denoted as kj, while predator-prey vulnerability will remain as kij. For predator estimates, a mix of high, low and default estimates were applied. For groups which were assumed to be overexploited, values were estimated using the “Estimate Vulnerabilities” interface. For the predator-prey estimates, the Ecosim sensitivity search was used to identify the 10 most sensitive predator/prey kij parameters, which were then adjusted to ensure a range of high and low kij estimates were included.
For the purpose of this exercise, these two simulations (one with predator kj and one with predator-prey kij) were viewed as perfect representations of their ecosystems, i.e., the biomass and catch simulations were “real observations” driven by the “true” vulnerability multipliers. The aim of the following exercise was to test whether, when using these “real observations” as calibration time series, the “true” vulnerability multipliers would reemerge, and whether the addition of noise to the “real observations” had any impact on the emerging vulnerability multipliers. Biomass and catch simulations were extracted from Ecosim and four scenarios for observation data quality were prepared: noise (random noise, normally distributed around the mean (true) biomass trend to represent observation error) was added to the calibration time series with coefficients of variation (CV) of 0 (no noise) 0.1, 0.3, and 0.5.
Predator vulnerability multipliers
Vulnerability multipliers were reset to the default value of 2; fishing dynamics were not changed from those used to produce the “real observations.” The exported biomass and catch time series were used as calibration time series to estimate predator vulnerability multipliers for the functional groups seals, cod, whiting, shrimp, benthos, and zooplankton using the manual stepwise fitting interface. kj values for groups which had values of 2 in the initial model were not altered.
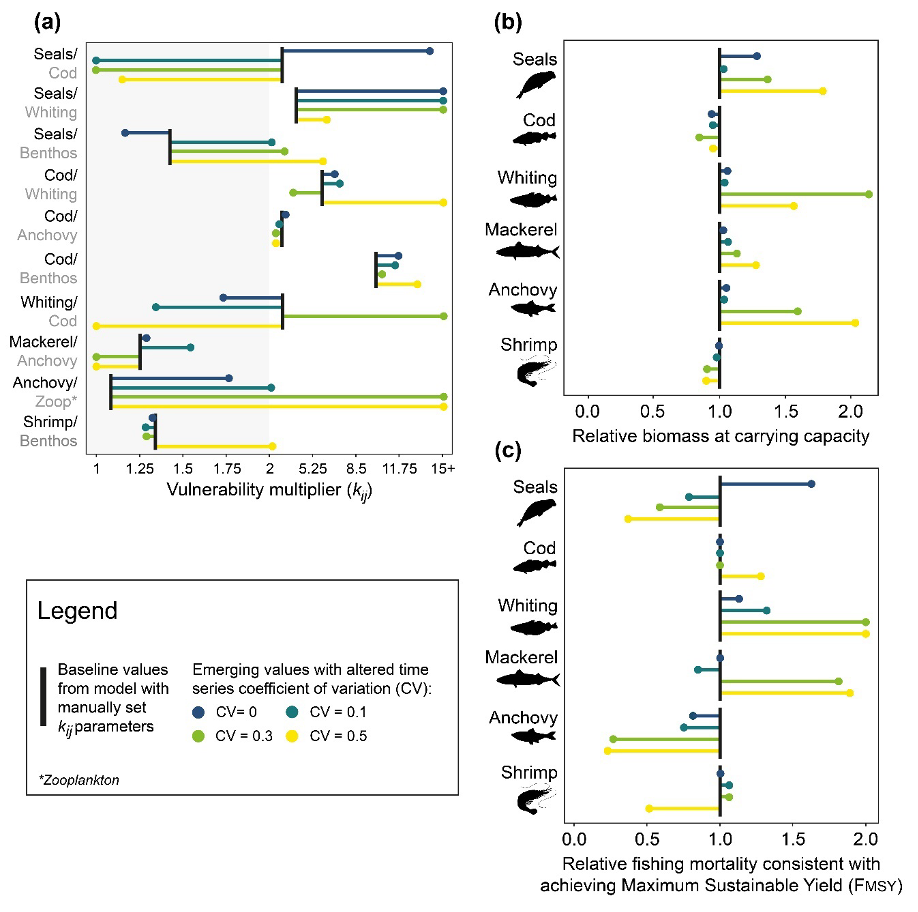
Figure 1 shows how kj parameters emerged after model calibration, and how this altered functional group carrying capacities in the absence of fishing and FMSY estimates. kj values which emerged when estimated using the calibration time series with no noise were similar to the “true” parameters (Figure 1a). Adding noise to the calibration time series led to divergence between the estimated kj values and the “true” parameters, highlighting the impact data quality can have on the fitting procedure and thus stressing the importance of evaluating the suitability of time series before using them to drive model calibration. The variability in kj re-emergence under the four data quality scenarios was also unique to specific functional groups, for example: kj estimates for cod showed greater re-emergence accuracy (or consistency) when compared to other functional groups. Cod is highly connected within the food web (i.e., cod is an opportunistic predator which is also preyed upon by higher trophic levels), therefore vulnerability multipliers which improve the model fit tend to be more constrained due to their potential to have large cascading impacts on the wider food web. In addition, cod also experienced a period of collapse followed by recovery, which provides much needed contrast for the model to reliably estimate the vulnerability multipliers.

Figure 1. Estimation and impact of predator vulnerability multipliers (kj). The Anchovy Bay ecosystem model was calibrated against generated time series with incremental coefficients of variation (CV) to identify the impact of time series quality on (a) kj re-emergence and how kj estimates impacted (b) functional group carrying capacities in the absence of fishing and (c) estimates of relative fishing mortality consistent with achieving Maximum Sustainable Yield (FMSY).
Functional group carrying capacities and estimates of FMSY were impacted by emerging values (Figure 1b and 1c). Carrying capacities from scenarios with parameters calibrated against data with no noise were most similar to those achieved with the “true” parameters (Figure 1b), with dissimilarity generally increasing with the addition of noise to the calibration data. The importance of acknowledging the impact of estimates beyond model fit is demonstrated with the resulting FMSY estimates: relative changes to FMSY estimates mirrored the deviations of estimated values relative to the “true” values (Figure 1c). Increases in values led to decreases in FMSY, while decreases in values led to increases in FMSY This is because higher values enable groups to recover faster with the cessation of fishing and reach a higher carrying capacity, but they also decrease stock resilience to increases in F (functional groups decline faster and more severely if you increase their ). It is worth noting that where differences between true and estimated FMSY occurred, they were not proportional to the difference in true and estimated vulnerability multipliers (i.e., large changes in kij do not result in equally large changes to FMSY).
Predator-prey vulnerability multipliers
Similar to the predator scenario, vulnerability multipliers were reset to the default of 2, and the exported biomass and catch time series (generated with “true” predator-prey vulnerability multipliers) were used as calibration time series to estimate predator-prey vulnerability multipliers. Predator-prey values for the ten most sensitive predator/prey parameters were estimated using the manual stepwise fitting interface. Figure 2 shows how parameters emerged and how this altered functional group carrying capacities and FMSY estimates.
In comparison to the emergence of predator vulnerabilities, the emergence of predator-prey vulnerabilities was less constrained with examples of poor re-emergence accuracy across all calibration data scenarios (Figure 2a). Functional group carrying capacities showed higher dissimilarity from their baseline when compared to predator simulations and their baseline (Figure 2b). Carrying capacity dissimilarity increased with the addition of noise to the calibration data, however simulations with no/low noise were notably more dissimilar when estimating predator-prey vulnerabilities as opposed to predator vulnerabilities (Figure 2b) which is due to the greater differences in kij estimates.
Relative FMSY estimates, influenced by predator-prey kij values, showed higher dissimilarity from their baseline (Figure 2C) when compared to FMSY estimates influenced by predator kj values (Figure 1C). The links between predator-prey kij values and FMSY are less obvious than the links between predator kj values and FMSY due to the more complex interaction-specific consumption limits. This is particularly true for groups with mixed diets (e.g., cod, whiting, seals, and mackerel) while links between predator-prey values and the FMSY estimates for groups, which are heavily dependent on a single prey group were observed for anchovy (FMSY mirrors the anchovy/zooplankton kij estimates) and shrimp (FMSY mirrors the shrimp/benthos kij estimates).
Media Attributions
- From Bentley et al. 2024 Figure 5
- From Bentley et al. 2024. Figure 6
- See Bentley et al. 2024 Supplementary Data for details about the model construction ↵
